
7. September 2026 Standorte
The head office gets a completely new tab Inventory Management – with cross-location statistics on goods sales.
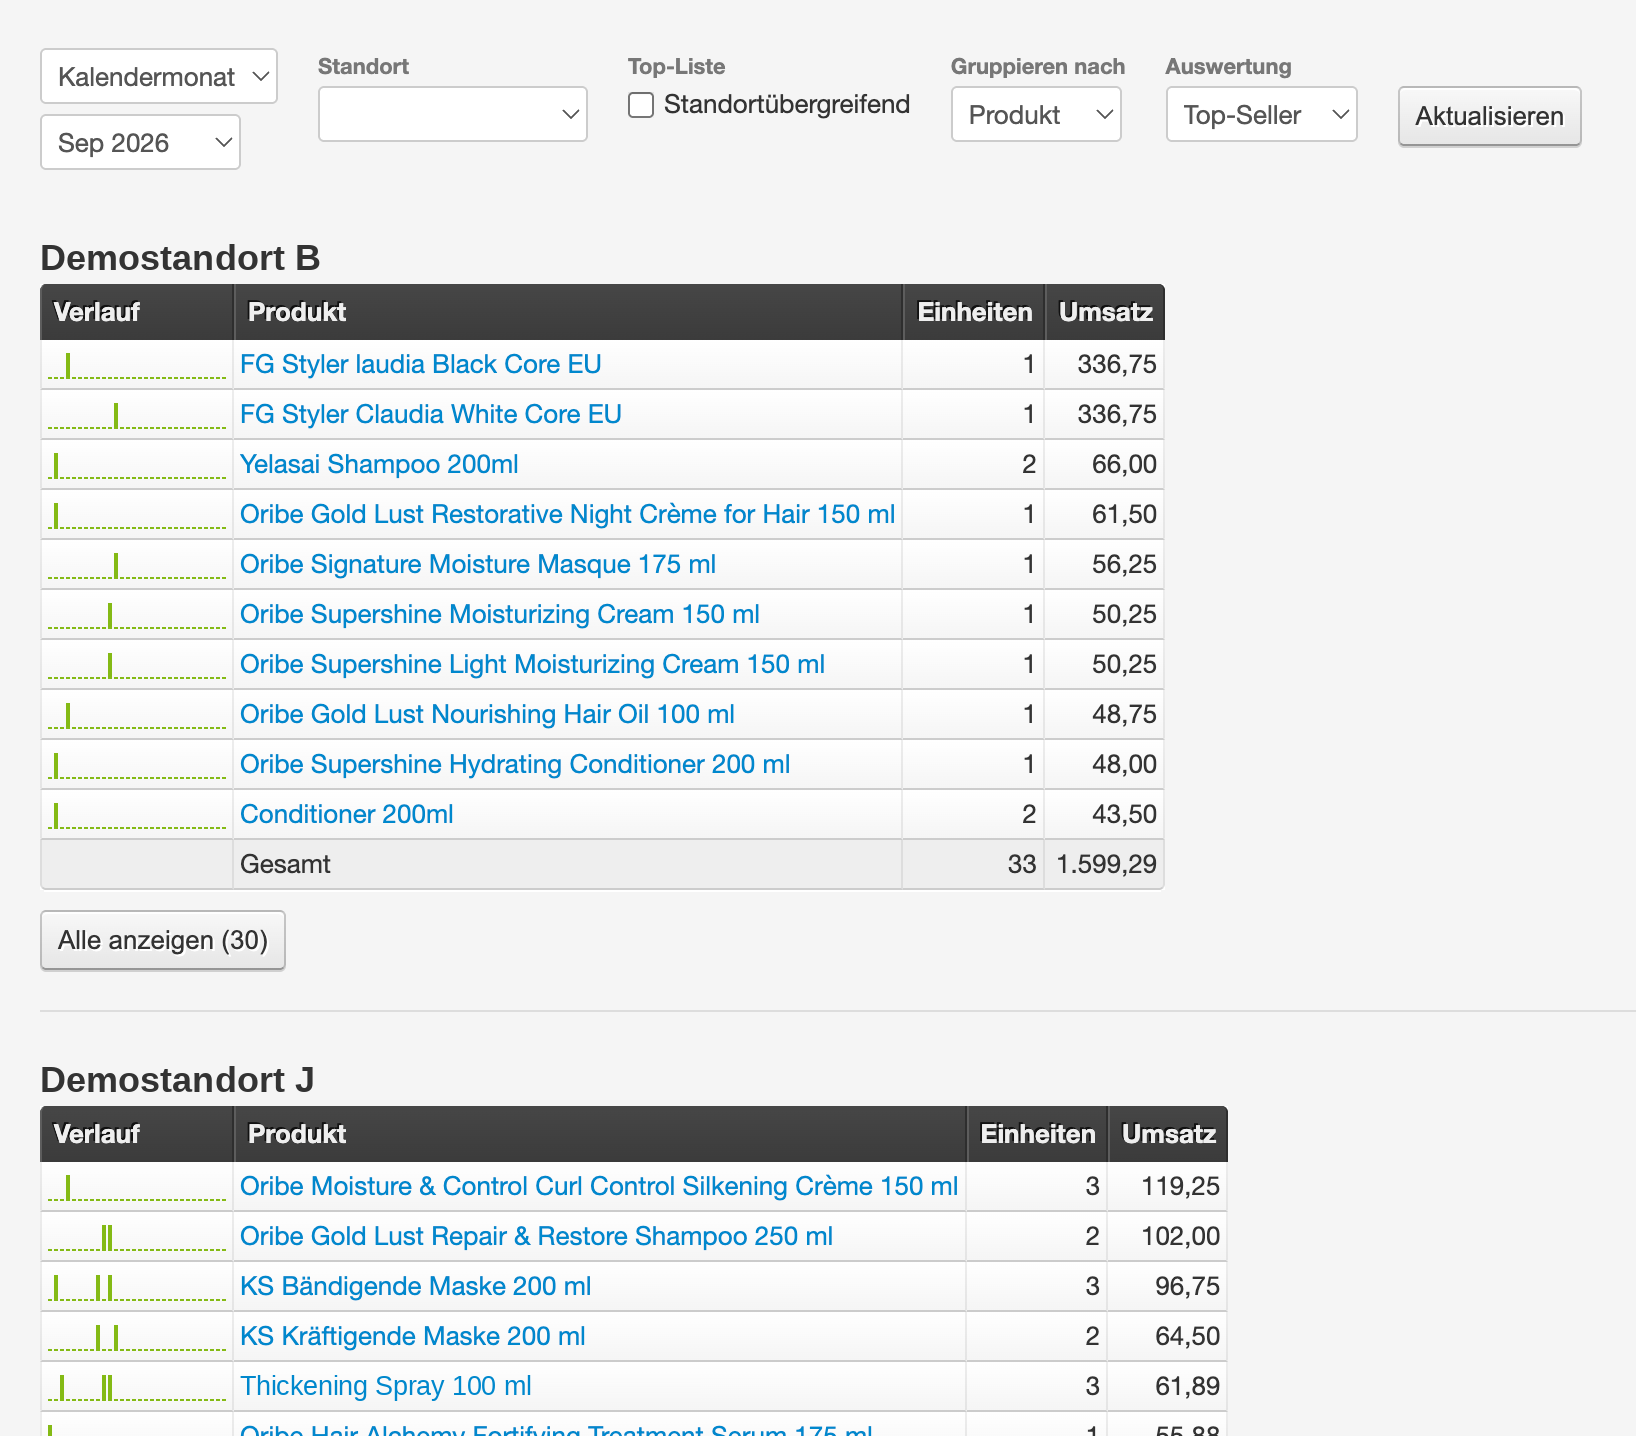
The new tab lists goods sales per location in its own table: Progression as a small bar chart, Product, sold Units and Revenue, concluded by a total line. Initially, the ten strongest items are displayed – "Show all" expands the complete list.
The filter row above controls what is evaluated:
| Filter | Selection and effect |
|---|---|
| Time period | Type of time period – such as calendar month – and the specific time period |
| Location | Limits the evaluation to a single location |
| Top list | Cross-location combines all locations into a single ranking instead of displaying them separately per location |
| Group by | Product Product group Manufacturer Supplier |
| Evaluation | Top sellers shows the best sellers, Slow movers the goods that don't sell |
Grouping by manufacturer or supplier answers a different question than grouping by product: not which article sells best, but which brand or supplier generates the most revenue.
Clicking on a row opens the detail view – depending on the grouping for a single product, a product group, a manufacturer or a supplier.
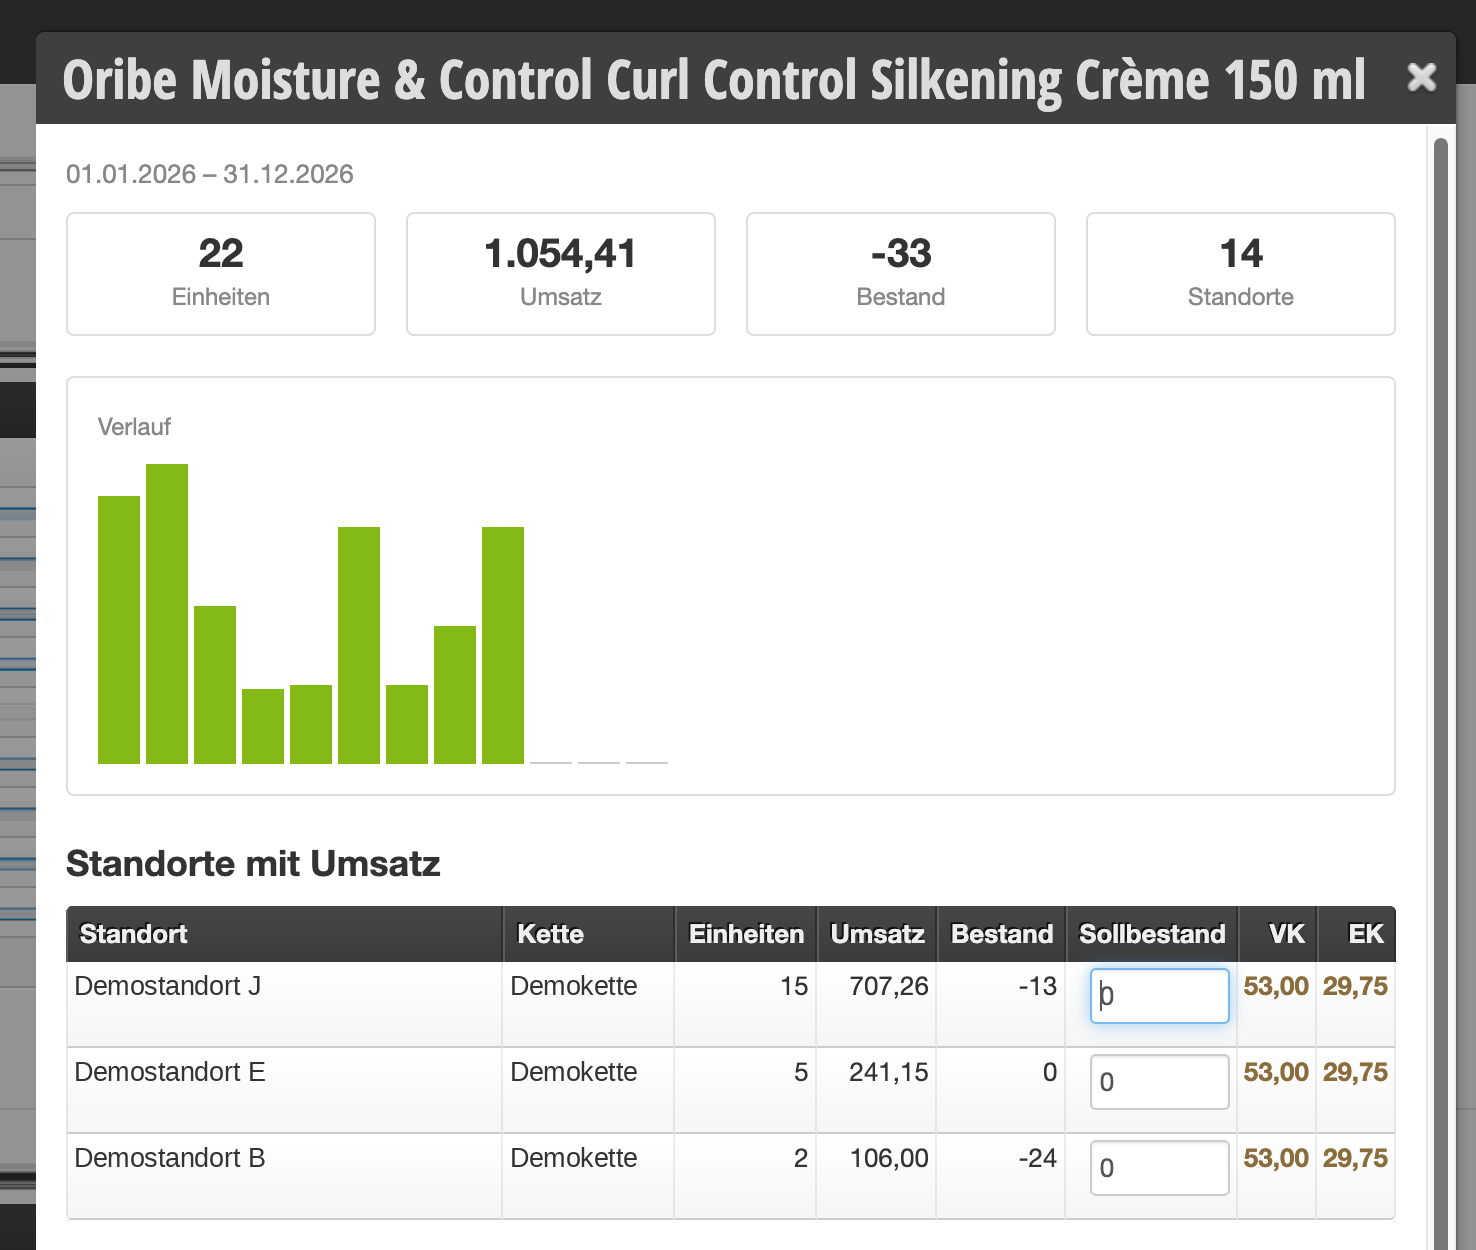
At the top are the key figures for the selected time period: sold Units, Revenue, Stock and Locations. Below that, a progression chart shows how sales are distributed over the time period – outliers and seasonality become immediately apparent.
The Locations with revenue table breaks down which locations contributed to revenue, each with units, revenue, stock as well as sales and purchase price. The Target stock can be entered directly in the detail view: The evaluation doesn't stop at the finding, but is also the place where the consequences are recorded immediately.
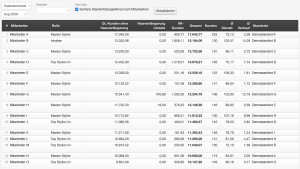
In parallel, the Employee statistics have been completely rewritten. It is now structured as a ranking and displays for each employee side by side:
| Column | Content |
|---|---|
| Role | Function in the business, such as Master Stylist or Owner |
| Revenue | Services and sales shown separately, plus the Total column |
| Customers | Number of customers served during the selected time period |
| Ø Service / Ø Sales | Average service and sales revenue per customer |
| Locations | Location where the revenue was generated |
The checkbox Sort cross-location by employees sets the ranking across all locations. The average per customer is often more informative than total revenue: It shows who makes a lot from few appointments – and who has room for improvement in sales.